2025
Decision-Ready Subscription Analytics
As Superside scaled its enterprise customer base, subscription data was becoming a hidden cost. Account managers couldn't interpret their own usage without help from success managers — creating bottlenecks, slowing decisions, and preventing the team from focusing on strategic customer engagement.
The business question: could we give customers the tools to understand their own subscription health, and free up success teams to focus on growth rather than explanation?
ROLE
Lead product designer
TEAM
1 product manager
2 Frontend engineers
2 Backend engineers
IMPACT
• Enabled self-serve subscription decision-making at enterprise scale
• Reduced reliance on success managers for data interpretation
• Reusable chart system contributed to the platform-wide DS library
Problem
A data bottleneck slowing enterprise decisions
Success managers were spending significant time interpreting subscription data for customers — a bottleneck that didn't scale as the enterprise base grew.
The data existed. The problem was how it was presented. Dense, table-driven layouts showed numbers but failed to explain what was happening or why it mattered — increasing reliance on human interpretation rather than enabling self-serve decisions.
SOLUTION
A Narrative-Driven Data Experience
The solution reframed the question: rather than improving the tables, we asked what questions customers actually needed to answer — and built the experience around those.
AI tooling was used to accelerate synthesis and maintain consistency, but the primary focus was clarity, trust, and decision-making.
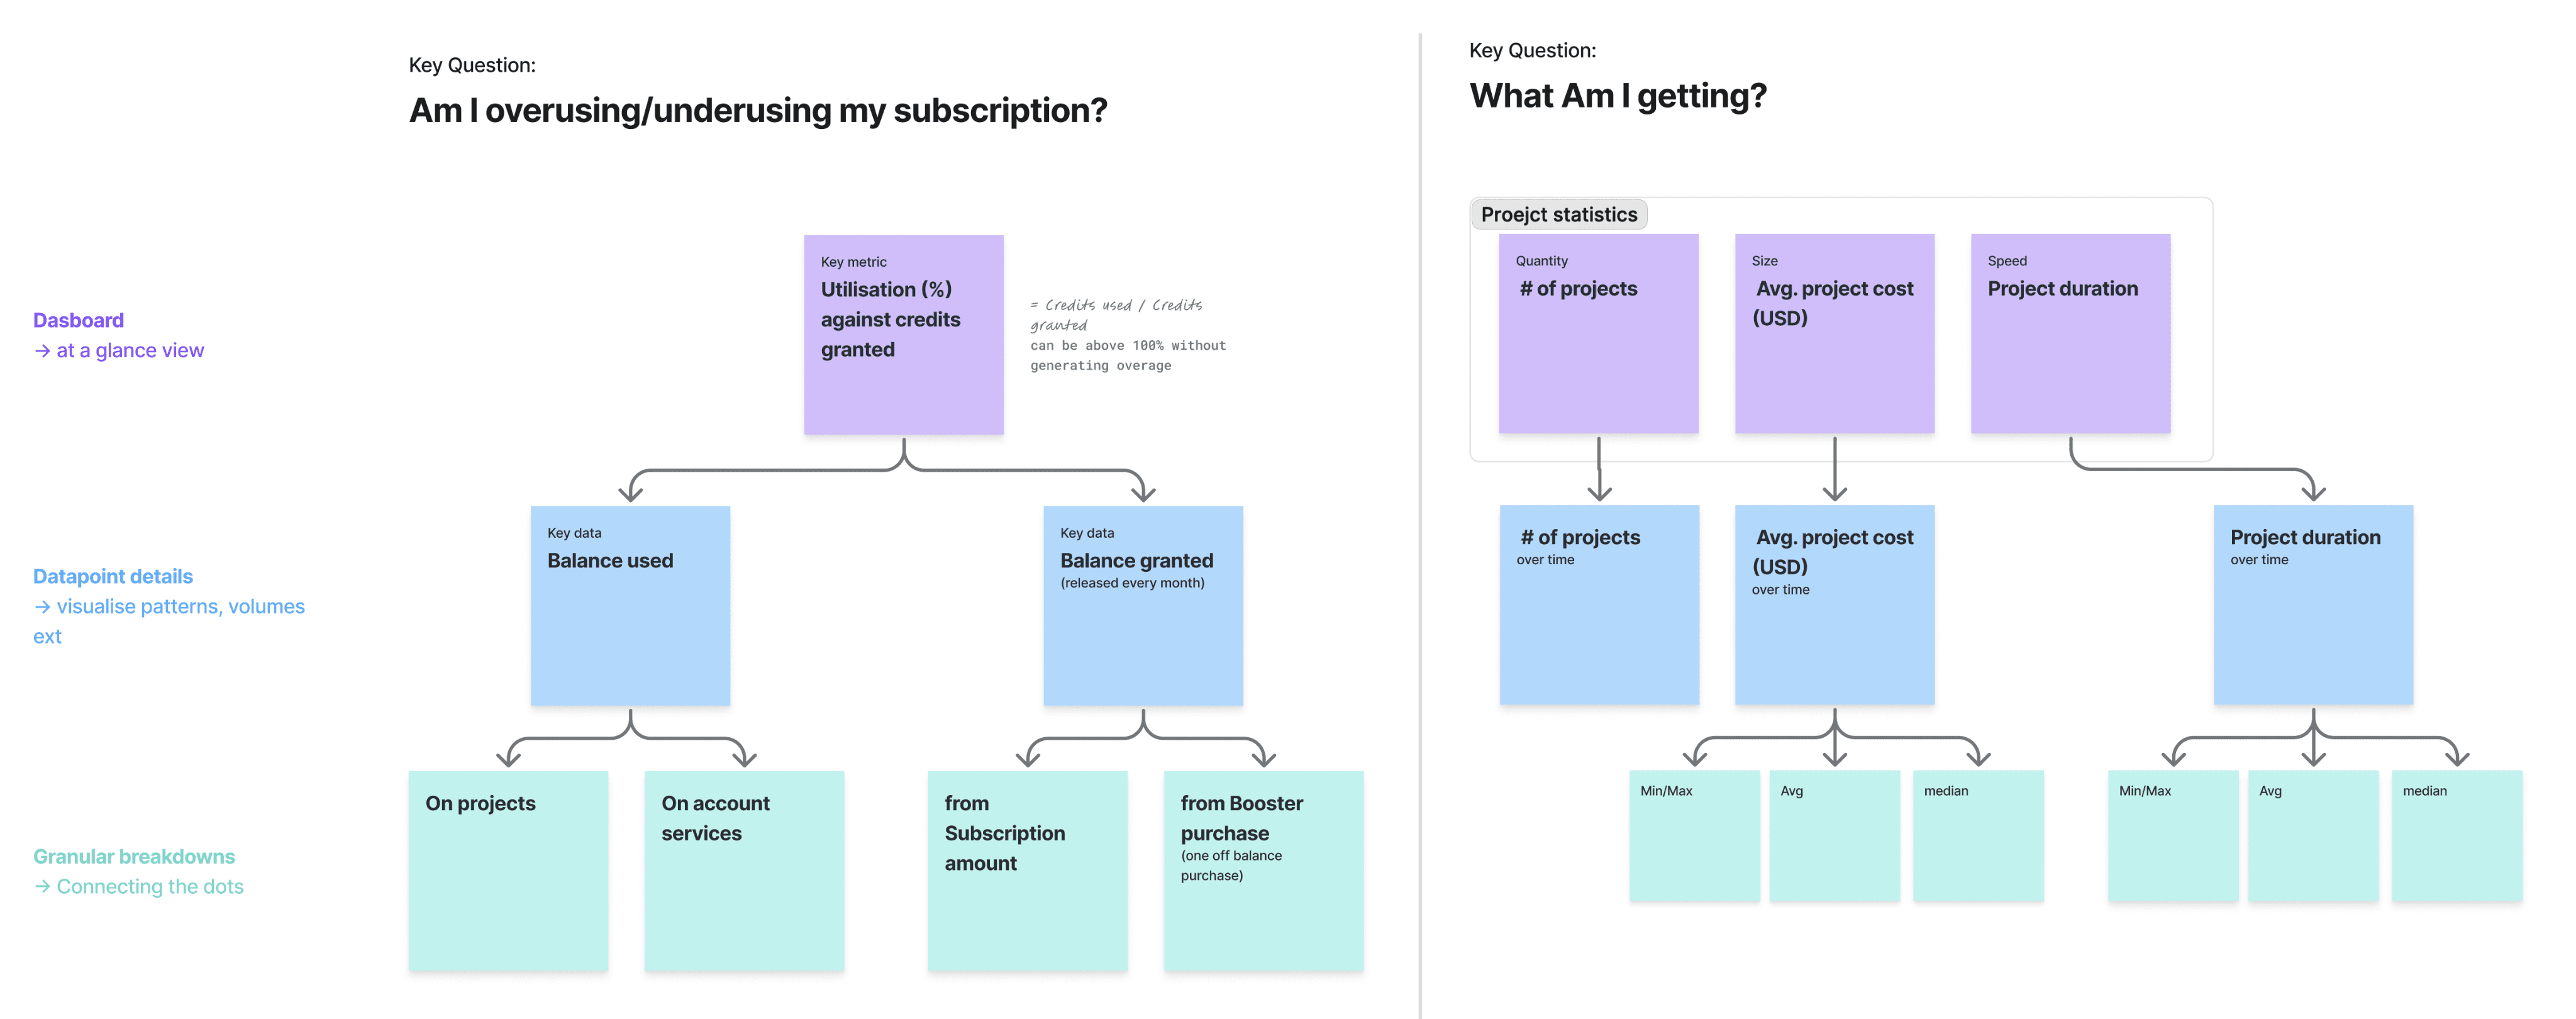
01. Build a Story Through Data
Subscription data was structured around the questions customers actually ask, rather than the metrics the system produced.
Key questions surfaced at the top (e.g. “Am I overspending?”)
Usage and cost trends grouped into meaningful stories
Raw data remained accessible without overwhelming the primary view
02. Simple and layered visual experience
The interface balanced clarity and depth through progressive disclosure.
Surface-level insight: Key trends visible at a glance
Deeper exploration: Progressive drill-downs for detailed analysis
Built-in guidance: Plain-language annotations explaining what metrics mean
IMPACT & RESULTS
From Confusion to Confidence: Driving Self-Service at Scale
The narrative-driven dashboard shifted subscription data from a source of friction to a self-serve decision tool. Customers could now interpret their own usage and spending without external support — and success teams moved from explaining metrics to having more strategic conversations with accounts.
The reusable chart and interaction system was contributed to the platform-wide DS library, reducing the cost of building analytics experiences across the product and laying the foundation for future data-driven features.

